PG Program in Data Science and Engineering
Start a successful career in Data Science
- 10 guaranteed interviews
- 5 months program
- Immersive in-person classroom program
- No technical expertise required
Course Details
225+ Hour
Immersive classroom learning
5+
Languages & Tools
5 Months
Duration
Class Timings
Monday to Thursday at 9:30 AM at Great Learning Centers
Batch Start Dates

Pune
22nd Jan, 2023

Hyderabad
22nd Jan, 2023

Bangalore
22nd Jan, 2023

Mumbai
22nd Jan, 2023

Gurgaon
22nd Jan, 2023

Chennai
22nd Jan, 2023
What will you get?

Guaranteed interviews from 10 companies

Dedicated Superset Placement Drives

Free Mock interviews with industry experts

Live Career Mentorship sessions

Personalized Resume building and LinkedIn Review

PG Certification from the Best Analytics School in the
country
What sets us apart?
Average CTC
7 LPA
Maximum CTC
20 LPA
Students placed so far
1750+
Early Bird Special Price
Recover your entire investment in 6 months

Starting from ₹ 17,700/month
More than 50% students pay using the monthly payment plan
Where are your fellow learners now?
-
 Mahendra ShajiAnalytics Consultant, Fractal Analytics
-
 Salil TrehanResearch Executive, Nielsen
-
 Runav DesaiExecutive Data Scientist, NielsenIQ
-
 Shawrya SharmaAdvanced Insight Analyst, Expedia Group
-
 Ankit AroraAssociate Consultant (Data Scientist), Capgemini
-
 SAI Ramya MachavarapuBusiness Analyst, Mercedes Benz
-
 Ritesh ChoudhuryApplication Development Analyst, Accenture
-
 Suraj SureshData Scientist, DXC Technology
Course Curriculum
The curriculum has been designed by faculty from Great Lakes and
highly skilled experts of data science.
225+ Hour
Immersive classroom learning
5+
Languages & Tools
Foundations
The Foundations block comprises four courses where we get our hands dirty with
the introduction to Python, Exploratory
Data Analysis, Statistics, SQL Programming, and some domain-specific knowledge
head-on. These courses set our
foundations so that we sail through the rest of the journey with minimal
hindrance.
-
This module will let us get comfortable with the Python
programming language used for Data Science. We start with a
high-level idea of Object-Oriented Programming and later
learn the essential vocabulary(/keywords), grammar(/syntax)
and
sentence formation(/usable code) of this language.
-
Syntax and Semantics of Python programming
Python is a widely used high-level programming language and has a simple, easy-to-learn syntax that highlights readability. This module will help you drive through all the fundamentals of programming in Python, such as syntax and semantics, and at the end, you will execute your first Python program. -
Conditional statements
Conditional Statements perform various operations based on a boolean condition that evaluates to true or false. In this module, you will learn to implement if-else statements in Python. -
Loops
A loop is used for executing one or more statements several times mentioned. It will repeat the sequence of information until it meets a specified condition. This module will teach you how to implement for and while loops. -
Iterators
Iterators are objects containing values, where you can traverse through them. This module will teach you how to implement Iterator methods like __iter__() and __next__(). -
User-defined functions
User-defined functions are functions created by the programmer to perform any application-specific operations. In this module, you will implement user-defined functions in Python using the def keyword. -
NumPy
This module will give you a deep understanding of exploring data sets using NumPy. NumPy is one of the most widely used Python libraries. NumPy is a package for scientific computing like working with arrays. -
Pandas
Pandas is also one of the most widely used Python libraries. Pandas is used to analyse and manipulate data. This module will give you a deep understanding of exploring data sets using Pandas.
-
This module of PG in Data Science courses will teach you all
about Exploratory Data Analysis like Pandas, Seaborn,
Matplotlib, and Summary Statistics.
-
Pandas
Pandas is one of the most widely used Python libraries. Pandas is used to analyse and manipulate data. This module will give you a deep understanding of exploring data sets using Pandas. -
Summary statistics (mean, median, mode,
variance, standard deviation)
In this module, you will learn about various statistical formulas and implement them using Python. -
Seaborn
Seaborn is also one of the most widely used Python libraries. Seaborn is a Matplotlib based data visualisation library in Python. This module will give you a deep understanding of exploring data sets using Seaborn. -
matplotlib
Matplotlib is another widely used Python libraries. Matplotlib is a library to create statically animated, interactive visualisations. This module will give you a deep understanding of exploring data sets using Matplotlib.
-
In the next module, you will learn everything you need to
know about all the statistical methods used for decision
making in this Data Science PG course.
-
Probability distribution
A statistical function reporting all the probable values that a random variable takes within a specific range is known as a Probability Distribution. This module will teach you about Probability Distributions and various types like Binomial, Poisson, and Normal Distribution in Python. -
Normal distribution
Normal Distribution is the most critical Probability Distribution in Statistics, which describes the distribution of values of a variable. -
Poisson's distribution
Poisson's Distribution is a Probability Distribution in Statistics, which determines an event’s occurrence within a specified time interval. -
Bayes’ theorem
Baye’s Theorem is a mathematical formula named after Thomas Bayes, which determines conditional probability. Conditional Probability is the probability of an outcome occurring predicated on the previously occurred outcome. -
Central limit theorem
This module will teach you how to estimate a normal distribution using the Central Limit Theorem (CLT). -
Hypothesis testing
This module will teach you about Hypothesis Testing in Statistics. Hypothesis Testing is a necessary procedure in Applied Statistics for doing experiments based on the observed/surveyed data. -
One Sample T-Test
One-Sample T-Test is a Hypothesis testing method used in Statistics. In this module, you will learn to check whether an unknown population mean is different from a specific value using the One-Sample T-Test procedure. -
Anova and Chi-Square
Analysis of Variance, also known as ANOVA, is a statistical technique used in Data Science, which is used to split observed variance data into various components for additional analysis and tests.
Chi-Square is a Hypothesis testing method used in Statistics, which is used to measure how a model compares to actual observed data.
This module will teach you how to identify the significant differences between the means of two or more groups.
-
Here, we will cover everything you need to know about SQL
programming, such as DBMS, Normalization, Joins, etc.
-
Introduction to DBMS
Database Management Systems (DBMS) is a software tool where you can store, edit, and organise data in your database.
This module will teach you everything you need to know about DBMS. -
ER diagram
An Entity-Relationship (ER) diagram is a blueprint that portrays the relationship among entities and their attributes.
This module will teach you how to make an ER diagram using several entities and their attributes. -
Schema design
Schema design is a schema diagram that specifies the name of record type, data type, and other constraints like primary key, foreign key, etc. It is a logical view of the entire database. -
Key constraints and basics of normalization
Key Constraints are used for uniquely identifying an entity within its entity set, in which you have a primary key, foreign key, etc. Normalization is one of the essential concepts in DBMS, which is used for organising data to avoid data redundancy.
In this module, you will learn how and where to use all key constraints and normalization basics. -
Joins
As the name implies, a join is an operation that combines or joins data or rows from other tables based on the common fields amongst them.
In this module, you will go through the types of joins and learn how to combine data. -
Subqueries involving joins and aggregations
This module will teach you how to work with subqueries/commands that involve joins and aggregations. -
Sorting
As the name suggests, Sorting is a technique to arrange the records in a specific order for a clear understanding of reported data. This module will teach you how to sort data in any hierarchy like ascending or descending, etc. -
Independent subqueries
The inner query that is independent of the outer query is known as an independent subquery. This module will teach you how to work with independent subqueries. -
Correlated subqueries
The inner query that is dependent on the outer query is known as a correlated subquery. This module will teach you how to work with correlated subqueries. -
Analytic functions
A function that determines values in a group of rows and generates a single result for every row is known as an Analytic Function. -
Set operations
The operation that combines two or more queries into a single result is called a Set Operation. In this module, you will implement various set operators like UNION, INTERSECT, etc. -
Grouping and filtering
Grouping is a feature in SQL that arranges the same values into groups using some functions like SUM, AVG, etc.
Filtering is a powerful SQL technique, which is used for filtering or specifying a subset of data that matches specific criteria.
Machine Learning Techniques
The next module is Machine Learning that will teach us all the Machine Learning
techniques from scratch, and the
popularly used Classical ML algorithms that fall in each of the categories.
-
This module will get us comfortable with all the techniques
used in Linear and Logistic Regression.
-
Multiple linear regression
Multiple Linear Regression is a supervised machine learning algorithm involving multiple data variables for analysis. It is used for predicting one dependent variable using various independent variables.
This module will drive you through all the concepts of Multiple Linear Regression used in Machine Learning. -
Fitted regression lines
A fitted regression line is a mathematical regression equation on a graph for your data. This model can be used to identify the relationship between a predictor variable (x-scale) and a response variable (y-scale) so that it can assess whether the model fits your data. -
AIC, BIC, Model Fitting, Training and Test Data
In this module, you will go through everything you need to know about several models such as AIC, BIC, Model Fitting, Training, and Test Data. -
Introduction to Logistic regression,
interpretation, odds ratio
Logistic Regression is one of the most popular ML algorithms, like Linear Regression. It is a simple classification algorithm to predict the categorical dependent variables with the assistance of independent variables.
This module will drive you through all the Logistic Regression concepts used in Machine Learning, interpret Machine Learning models, and find the odds ratio relationship. -
Misclassification, Probability, AUC, R-Square
This module will teach everyone how to work with Misclassification, Probability, AUC, and R-Square.
-
In the next module, you will learn all the Supervised
Learning techniques used in Machine Learning.
-
CART
CART, also known as Classification And Regression Tree, is a predictive machine learning model that describes the prediction of outcome variable's values predicated on other values. You will learn about the usage of this predictive model in this module. -
KNN (classifier, distance metrics, KNN
regression)
KNN or k-Nearest Neighbours algorithm is one of the most straightforward machine learning algorithms for solving regression and classification problems.
You will learn about using this algorithm like classification, distance metrics, and KNN regression through this module. -
Decision Trees (hyper parameter, depth, number
of leaves)
Decision Tree is a Supervised Machine Learning algorithm used for both classification and regression problems. It is a hierarchical structure where internal nodes indicate the dataset features, branches represent the decision rules, and each leaf node indicates the result.
You will learn about hyperparameter, depth, and the number of leaves in this module. -
Naive Bayes
Naive Bayes Algorithm is used to solve classification problems using Baye’s Theorem. This module will teach you about the theorem and solving the problems using it.
-
In the next module, you will learn all the Unsupervised
Learning techniques used in Machine Learning.
-
Clustering - K-Means & Hierarchical
Clustering - K-Means & Hierarchical Clustering is an unsupervised learning technique involving the grouping of data. In this module, you will learn everything you need to know about the method and its types, like K-means clustering and hierarchical clustering.
K-means clustering is a popular unsupervised learning algorithm to resolve the clustering problems in Machine Learning or Data Science.
Hierarchical Clustering is an ML technique or algorithm to build a hierarchy or tree-like structure of clusters. For example, it is used to combine a list of unlabeled datasets into a cluster in the hierarchical structure. -
Distance methods - Euclidean, Manhattan,
Cosine, Mahalanobis
This module will teach you how to work with all the distance methods or measures such as Euclidean, Manhattan, Cosine, and Mahalanobis. -
Features of a Cluster - Labels, Centroids,
Inertia
This module will drive you through all the features of a Cluster like Labels, Centroids, and Inertia. -
Eigen vectors and Eigen values
In this module, you will learn how to implement Eigenvectors and Eigenvalues in a matrix. -
Principal component analysis
Principal Component Analysis is a technique to reduce the complexity of a model, like eliminating the number of input variables for a predictive model to avoid overfitting.
-
In this Machine Learning, we discuss supervised standalone
models’ shortcomings and learn a few techniques, such as
Ensemble techniques, to overcome these shortcomings.
-
Bagging & Boosting
Bagging, also known as Bootstrap Aggregation, is a meta-algorithm in machine learning used for enhancing the stability and accuracy of machine learning algorithms, which are used in statistical classification and regression.
As the name suggests, Boosting is a meta-algorithm in machine learning that converts robust classifiers from several weak classifiers. Boosting can be further classified as Gradient boosting and ADA boosting or Adaptive boosting. -
Random Forest
Random Forest is a popular supervised learning algorithm in machine learning. As the name indicates, it comprises several decision trees on the provided dataset’s several subsets. Then, it calculates the average for enhancing the dataset’s predictive accuracy. -
AdaBoost & Gradient boosting
Boosting can be further classified as Gradient boosting and ADA boosting or Adaptive boosting. This module will teach you about Gradient boosting and ADA boosting. -
Hackathon
Hackathon is an event usually hosted by a tech organisation, where computer programmers gather for a short period to collaborate on a software project.
Applications*
This module concentrates on the applications of Data
Science.
-
This block will teach you all the techniques involved in
Time Series.
-
Trend and seasonality
Trend is a systematic linear or non-linear component in Time Series metrics, which changes over a while and does not repeat.
Seasonality is a systematic linear or non-linear component in Time Series metrics, which changes over a while and repeats. -
Decomposition
This module will teach you how to decompose the time series data into Trend and Seasonality. -
Smoothing (moving average)
This module will teach you how to use this method for univariate data. -
SES, Holt & Holt-Winter Model
SES, Holt, and Holt-Winter Models are various Smoothing models, and you will learn everything you need to know about these models in this module. -
AR, Lag Series, ACF, PACF
In this module, you will learn about AR, Lag Series, ACF, and PACF models used in Time Series. -
ADF, Random walk and Auto Arima
In this module, you will learn about ADF, Random walk, and Auto Arima techniques used in Time Series.
-
In this module, you will learn how to convert unstructured
text into a structured text to discover relevant insights.
This method is known as Text Data Mining.
-
Text cleaning, regular expressions, Stemming,
Lemmatization
Text Cleaning is a necessary procedure to emphasize the attributes for your machine learning model to choose. Regular Expression is a language that states text search strings. Stemming is a technique used in Natural Language Processing (NLP), which plucks out the base form of words by the removal of affixes from the words. Lemmatization is another commonly used NLP technique, which combines the different inflected word forms to be analysed as a single item. -
Word cloud, Principal Component Analysis,
Bigrams & Trigrams
A word cloud is a data visualization technique, which is used to represent text data. This module will make you learn everything about Word cloud, Principal Component Analysis, Bigrams, and Trigrams used in Data Visualization. -
Web scrapping, Text summarization, Lex Rank
algorithm
Web Scraping is the process of extracting data from the web. This module will teach you how to collect and parse data using Web Scraping and learn how to implement Text Summarization and Lex Rank algorithm. -
Latent Dirichlet Allocation (LDA) Technique
The word ‘Latent’ indicates that the model discovers the ‘yet-to-be-found’ or hidden topics from the documents. ‘Dirichlet’ indicates LDA’s assumption that the distribution of topics in a document and the distribution of words in topics are both Dirichlet distributions. ‘Allocation’ indicates the distribution of topics in the document. -
Word2vec Architecture (Skip Grams vs CBOW)
Word2vec is a method to create word embeddings by using a two-layer neural network efficiently. It was developed by Tomas Mikolov et al. at Google in 2013 to make the neural-network-based training of the embedding more efficient and since then has become the de facto standard for developing pre-trained word embedding.
In this module, you will learn about the differences between Skip Grams and CBOW (Continuous Bag of Words). -
Text classification, Document vectors, Text
classification using Doc2vec
In this module, you will learn even more about Text Classification and Document Vectors using Doc2vec.
-
The last topic in this PG in Data Science program is Data
Visualization. The process of the graphical representation
of
data and information is known as Data Visualization. This
module will teach you how to use data visualization tools
for
providing data trends and patterns.
-
Building interactive dashboards using Tableau
In this module, you will learn how to create an interactive Tableau dashboard and charts to organise data. -
Data Visualization using Tableau
Tableau is the most widely used data visualization tool to solve problems. This module will teach you everything you need to know about Data Visualization using Tableau.
*Online Instruction
Capstone Project
You will get your hands dirty with real-time projects under industry
experts’ guidance, from Data Science, using Python
to Machine Learning, SQL and Tableau. Successful completion of the project will
earn you a post-graduate certification
in Data Science and Engineering course.
Career Preparation: Aptitude Skill Training and
Development, Resume Review Workshops, Interview
Preparation
This post-graduate certification program in Data Science and Engineering will
guide you through your career path with
Aptitude Skill Training and Development. The program will also guide you in
building your professional resume, attending
mock interviews to boost your confidence and nurture you to nail your
professional interviews.
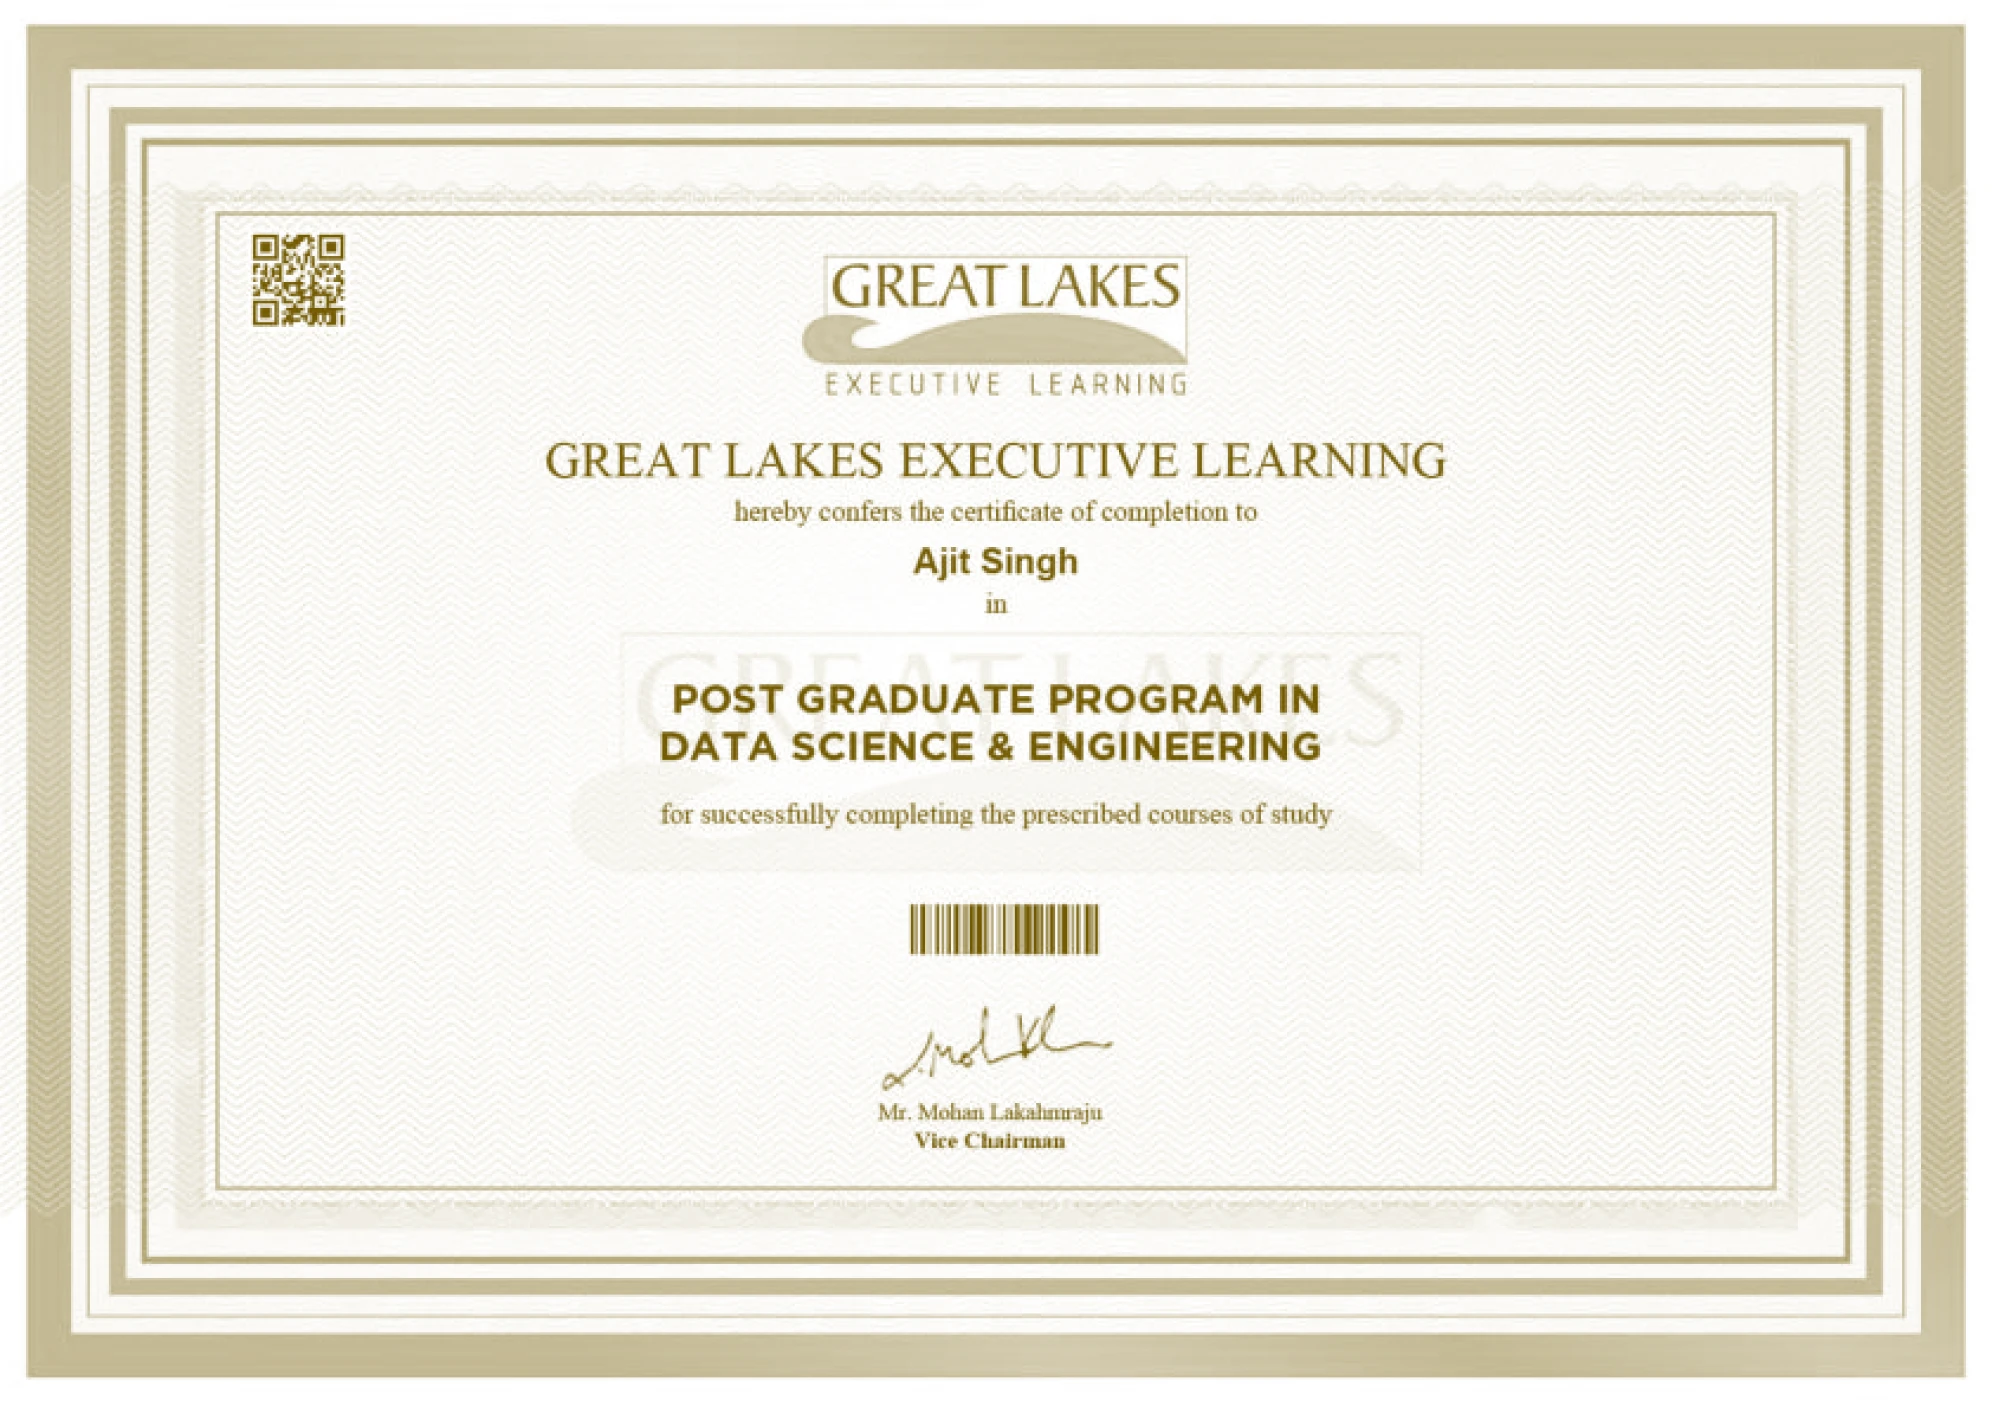
PG Certificate from Great Lakes Executive Learning
Earn a Postgraduate Certificate in the top-rated Data Science and Engineering
course from Great Lakes Executive
Learning.
Its exhaustive Curriculum will foster you into a highly-skilled professional and help you land a job at the world’s leading corporations.
Its exhaustive Curriculum will foster you into a highly-skilled professional and help you land a job at the world’s leading corporations.
Exclusive Campus Hiring Drive
If you are looking for a Data Science course with placement opportunities, this
is the right Data Science and
Engineering course to excel in your career. This course offers you exclusive
campus hiring opportunities with three
months of placement assistance after the program completion.
Languages and Tools covered
 and more...
Hands on Projects
1000+
Projects Completed
15+
Domains

Healthcare
Predictive model for Diabetes Treatments

Retail
Retail Sales prediction

Realty
Realty Predictive modeling on House Value

BFSI
Prediction of Loan interest rates
And More...
Our Faculty
Learn from leading academicians in the field of Data Science and
Engineering and top industry practitioners.
-
 Dr. Abhinanda SarkarPhd in Statistics (Stanford University)Faculty Director, Great Learning
 -
 Dr. Srabashi BasuPhd (Penn State University, USA)Professor, Business Analytics
 -
 Dr. Mudit KulshreshthaPhd (IGIDR, Advanced Research Institute of Reserve Bank of India)Professor, Great Lakes
 -
 Dr. D NarayanaPhd (Pierre & Marie Curie University, Paris)Professor, Artificial Intelligence and Machine Learning, Great Learning
 -
 Mr. Rajesh JakhotiaMP (IIM, Calcutta)Founding Member, K2 Analytics Finishing School
 -
 Prof. Mukesh RaoPGDBA (SIMS)Director, Great Learning
 -
 Mr. Deepesh SinghExecutive Programme (IIM Lucknow)Senior Data Scientist, ABInBev
 -
 Mr. Gurumoorthy PattabiramanMsc (Madras School of Economics)Faculty, Data Science & ML, Great Learning
 -
 Mr. Kathirmani SukumarB.E (Rajalakshmi Engineering college)Foundr, Quelit
 -
 Mr. Pushkar ShahMS (The University of Edinburg)Teaching Faculty, Great Lakes
 -
 Prof Saurabh AggarwalM Tech (IIT, Kanpur)Professor, HBTI Kanpur
 -
 Mr. R VivekanandMBA (Monash University Melbourne Vic.)FOperations Director, Wilson Consulting Private Limited
Get Certified by
India's Best Analytics School.
India's Best Analytics School.

Ranked in Analytics Education
Analytics India Magazine

Top Standalone Institution
Outlook India
Top Private B-Schools
Careers360

Top Non-IIM/IIT Institute
NIRF
COVID Safety Measures
How are we ensuring that we keep our learners safe in classroom settings?
- Lesser intake - Limited no. of students in 1 classroom (as per guidelines)
- Properly sanitized rooms before and after classes (as per guidelines)
- Temperature checks for every student/faculty before classes
- Option to move to Live Virtual Classes in case of insecurity anytime during the program
Superset enables colleges to automate end-to-end campus
placements, helps employers hire young talent from across
colleges in the country, and empowers students to access
opportunities democratically.
Universities
Employers
Students
Student Help

Follow us


